Creating basic charts in Excel is a straightforward process that allows you to visually represent your data to identify trends and patterns. Here’s how you can create common types of charts, such as column, bar, and pie charts:
Column Chart:
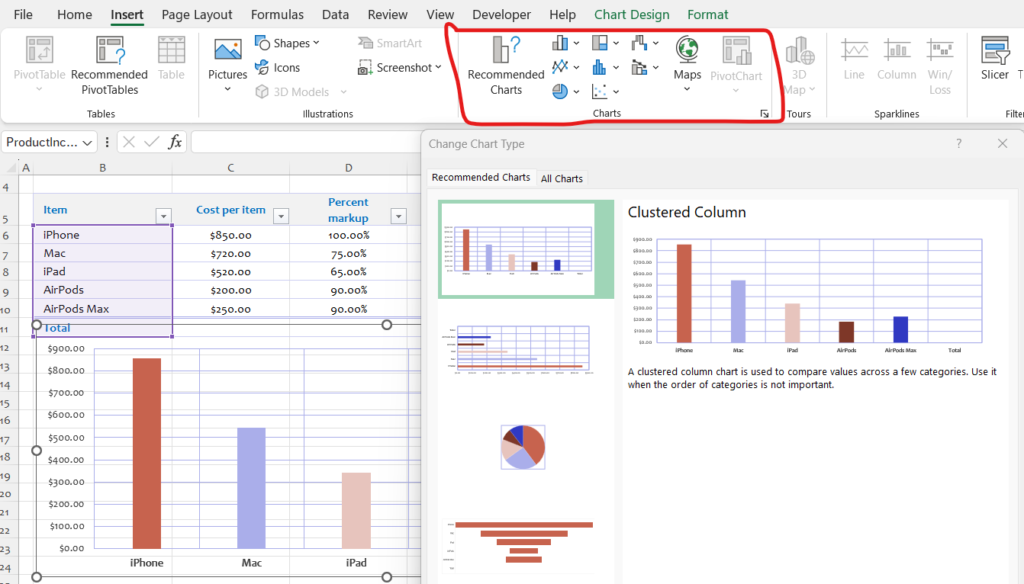
- Select the data you want to include in the chart, including any labels or headers.
- Go to the “Insert” tab on the Excel ribbon.
- In the “Charts” group, click on the “Column” button.
- Choose the desired column chart style from the dropdown menu (e.g., clustered column, stacked column).
- Excel will insert the column chart on your worksheet.
Bar Chart:
- Select the data you want to include in the chart, including any labels or headers.
- Go to the “Insert” tab on the Excel ribbon.
- In the “Charts” group, click on the “Bar” button.
- Choose the desired bar chart style from the dropdown menu (e.g., clustered bar, stacked bar).
- Excel will insert the bar chart on your worksheet.
Pie Chart:
- Select the data you want to include in the chart, including any labels or headers.
- Go to the “Insert” tab on the Excel ribbon.
- In the “Charts” group, click on the “Pie” button.
- Excel will insert a default pie chart on your worksheet.
- To customize the pie chart further, click on the chart to select it, then use the “Chart Elements” and “Chart Styles” buttons that appear next to the chart to make adjustments.
Additional Tips:
- After creating a chart, you can further customize it by right-clicking on various chart elements (e.g., axes, data series) and selecting “Format Chart Area” or “Format Data Series” to adjust colors, fonts, and other properties.
- Excel offers a variety of chart styles and options, so feel free to experiment with different chart types and formatting until you achieve the desired visualization.
By creating charts in Excel, you can effectively communicate your data insights and make it easier for others to understand the trends and patterns present in your data.